![]()
Statistical accuracy assessment
Submitted by Anonymous on Mon, 2012-05-14 21:52


- Building a validation database
- The Landsat Global Land Survey (GLS) database. Nearly complete global coverage from the Landsat satellites is now available at no cost from USGS. The GLS products at 28.5 m × 28.5 m resolution were created from the epochs circa 2000 and mid-2000s. GLS-2010 is under creation.
- Data derived from other moderate or higher resolution satellite imagery: “TropForest” dataset covering sample units over South America and South East Asia for epoch 2010, and complementary SPOT imagery to be acquired through Third Parties Missions. Google Earth imagery and multi-temporal NDVI profiles will also be used during the interpretation phase.
- The GLC2000 and GlobCover reference validation databases. These datasets will be used for the comparison with other global products.
- Sampling strategy
- Image interpretation procedure
- Reporting of results
The project will optimize the use existing reference datasets, in particular by relying on the following datasets:
As data and resources availability must be ptimized, the selection of the reference data to be interpreted and used to validate the CCI land cover products needs to be selected in a statistically valid manner. For this purpose, the systematic sampling of the JRC TREES dataset (based on a lat/long geographical grid) combined with a two-stage stratified clustered sampling has been considered as the most efficient sampling.
A stratified random sampling (two strata) allows the selection of primary sampling units (PSU) from the entire population of potential primary units (i.e. sample units selected from the systematic grid with equal area probability), while secondary sampling units (SSU) are systematically distributed within the PSU sample units. The resources dedicated to the validation exercise constrain the number of SSUs to be interpreted. For this PVP, 2600 PSUs are initially selected as target number to allow achieving a pre-required accuracy precision.
Only a limited part of each medium resolution satellite scene will be analyzed to produce a PSU interpretation. It is planned to interpret five SSUs per 20 km × 20 km box, which will result in 5 times more SSUs than PSUs. The SSUs will be located at (i) the centre of each 20 km × 20 km box and (ii) at a distance of 5 km × 5 km from the centre of each box.
The use of remote sensing specialists with local expertise has proven to be the most efficient strategy for the interpretation of medium resolution imagery. The application of image pre-processing to the reference satellite imagery is intended to allow for a more consistent identification of land cover objects. The moderate and/or high resolution satellite imagery will be pre-processed with a few automatic steps: orthorectification based on orbital parameters, extraction of PSU boxes and radiometric calibration. An automatic object-oriented approach is also envisaged with a minimum mapping unit (MMU) of 5 hectares for segmentation of the satellite imagery. A few (five) land-cover classes can be produced from the automatic operational land cover processing chain of the JRC over the tropics (to be used as initial land cover information to be refined). The moderate and/or high resolution dataset will be used in combination with other satellite imagery such as Google Earth imagery and multi-temporal NDVI and NDWI profiles (to display seasonal variations of vegetation) available from year 2000 through UCL.
Experts from previous validation networks will be contacted for interpretation of the Landsat-type satellite imagery. Such experts will be invited to visit the premises of one of the CCI Land Cover team members with a total duration of one week work with each expert. All necessary datasets and infrastructure will be put at the disposal of the experts. The experts will use a graphical interface to interpret Landsat-type imagery over the SSUs. The interpretation legend will be developed according to the LCCS classifiers; the interface for the interpretation will be developed from the existing GlobCover interface and will combine satellite imagery and ancillary information, including existing maps. A manual will be distributed to the experts with the description of the method to be used for the labeling of the SSUs. During the phase of interpretation by experts, quality control procedures will be introduced including repetition of SSU interpretations, comparison between interpretations from different experts and analysis of very fine spatial resolution for a sub-sample. The analysis of very fine spatial resolution (e.g. 10 m × 10 m) should allow quantifying the absolute accuracy of the products, but will be limited by availability of such imagery.
At the end of the project a validation report will describe the implementation of the validation procedures and their results. This validation report will include the various parameters describing the accuracy of the map: contingency matrix, user’s and producer’s accuracy, Kappa statistics, and area statistics.
Accuracies will be derived by comparing CCI land cover products with the results of the independent interpretations over SSUs. Accuracies of individual categories will be reported through the user’s and the producer’s accuracy. A number of different user perspectives can be envisaged for land cover (such as the carbon content and net primary productivity) for the use of the products into different climate models. For each of these potential uses, a matrix of similarity between classes will be constructed to derive specific accuracies.
Results are expected to be published in peer-reviewed scientific journals.
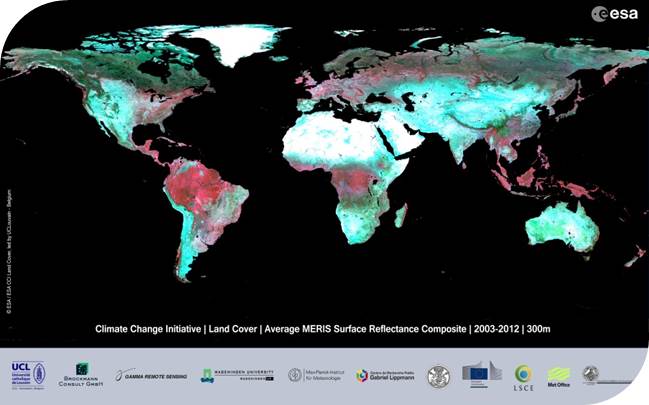
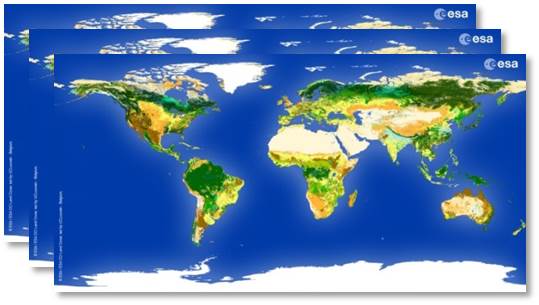
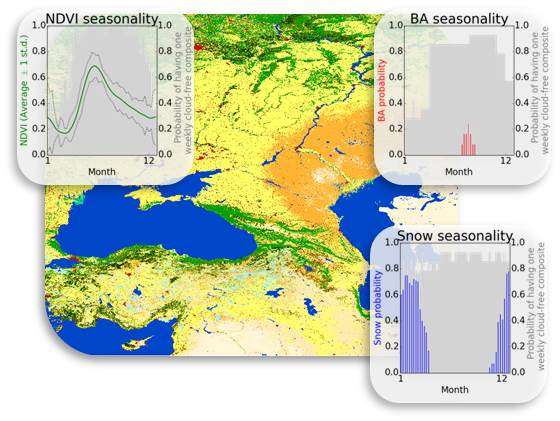
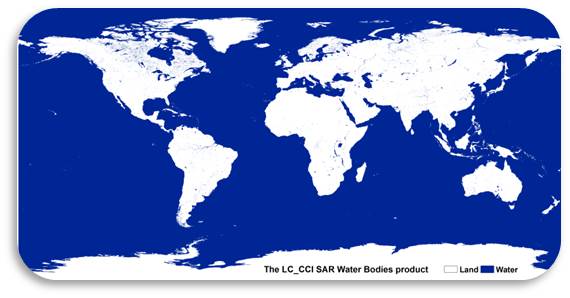
CCI Land Cover products